
A daily refrain that I hear when the Ontario government releases their COVID-19 numbers for the day is that the government is only releasing case counts and those don’t matter.
Both of those claims are wrong.
Case counts matter in order to watch trends, to monitor the spread in the community. That said they are not the only metric to be looked at which brings me to the other claim, that the government isn’t releasing enough information.
Not true.
Reams of data available if you know where to look
The reality is they are releasing more information than most of us can handle in a day. In fact, each day as Health Minister Christine Elliott tweets out the new numbers she links to one of the main places to find more information, the government’s main COVID-19 page.
From there you can scroll down a bit, see the topline numbers, and then click through for more data.
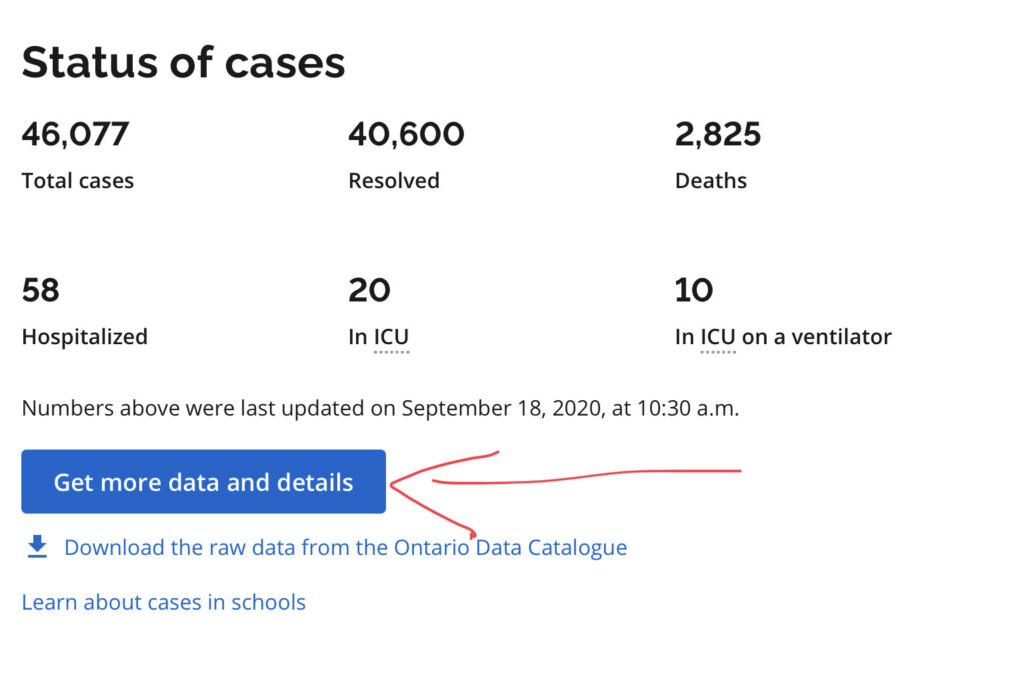
Clicking that link takes you to the main data portal where you can look at several charts in graph or table form and really break down what the numbers are and what they have been.
On this page you can also find the link to the daily and weekly epidemiologic summaries from Public Health Ontario. This will give you information such as the age breakdown of those infected and those who have died.
These reports go back to the end of March for daily reports and end of May for weekly summaries. You can even find source of infection in the weekly summaries.
Broken down further by school and LTC
Wondering about schools or long term care facilities? They have their own pages as well.
At the school page you get information on where infections have been found including which school or child care centre has seen infections.
At the long term care page you get similar information as well as infections amount residents versus staff. You may need to scroll down a bit to get to the LTC material.
You can also use the Public Health Ontario data tool to look at cases, hospitalizations and deaths and break it down by demographics – to a degree.
There was one report that looked at comorbidities and COVID-19. It examined all cases between January and May 14, some 1,825 deaths to that point or more than 60% of all COVID deaths in Ontario so far.
Of those, just 36.8% had one or more comorbidity while 63.2% had none.
There are local data portals out there, academic ones and private ones. There is an avalanche of information every day.
Could we use more detailed information in some areas? Sure, but there is no shortage of information and it goes well beyond a simple case count.